
Outcomes and Targets
In addition to the Priority Reforms targets, the National Agreement establishes 19 targets under 17 socio-economic outcome areas to bring focus to new areas and help monitor progress in improvements in the lives of Aboriginal and Torres Strait Islander people.
The socio-economic outcomes are focused on areas such as education, employment, health and wellbeing, justice, safety, housing, land and waters, and Aboriginal and Torres Strait Islander languages. They will be reported on annually by governments. Each target has five different elements:
Outcome
The overall socio-economic outcome status of this Agreement.Target
Specific and measurable keys that governments are publicly accountable for achieving.Indicators
Supporting measures that provide greater understanding of, and insight into, how all governments are tracking against the outcomes and targets.Disaggregation
Outlining how reporting of the target will be broken down and measured by groups of Aboriginal and Torres Strait Islander people. This enables greater understanding of where progress is being made and where greater effort is needed.Data development
Outlining areas that are important for understanding Aboriginal and Torres Strait Islander outcomes that can’t be measured currently due to a gap in the data and identifies whether further work is required.
Baseline and progress data on the socio-economic targets can be found at the Productivity Commission's website.
Disaggregation of data
Where possible, reporting on targets will be disaggregated by Aboriginal and Torres Strait Islander stolen generation survivors; people with disability; and LGBTQI status to make sure that progress on Closing the Gap can be monitored for these more vulnerable groups.
Where this is not possible due to data limitations, consideration will be given to how this data can be developed as part of the Data Development Plan.

Target 1
Close the Gap in life expectancy within a generation, by 2031.
Outcome 1 – Aboriginal and Torres Strait Islander people enjoy long and healthy lives.
-
Indicators
Drivers:
All-cause mortality
Leading causes of death (infant mortality, child mortality, and five-yearly age groups)
Potential avoidable mortality rates
Prevalence rates of health risk factors (smoking, alcohol and drug use, overweight and obese, dietary factors, physical activity)
Rates of accessing/utilisation of health services (General Practitioner (GP) visits, health assessments (Medicare Benefit 715), chronic disease care items (Team Care arrangement and GP Management Plan)
Contextual information:
Hospitalisation rates by leading causes
Discharge against medical advice
Burden of disease from socio-economic factors
Disaggregation
States/territories
Remoteness areas
Socio-economic status of the locality
Gender
Data development
Explore options to measure and report:
Aboriginal and Torres Strait Islander life expectancy estimates by all states and territories; and at more frequent intervals
A broader measure of access to services compared to need to include availability and distance travelled, affordability, client preferences and cultural safety
Burden of disease related to a broader range of health risk factors; and at more frequent intervals
Broader measures of wellbeing
Target 2
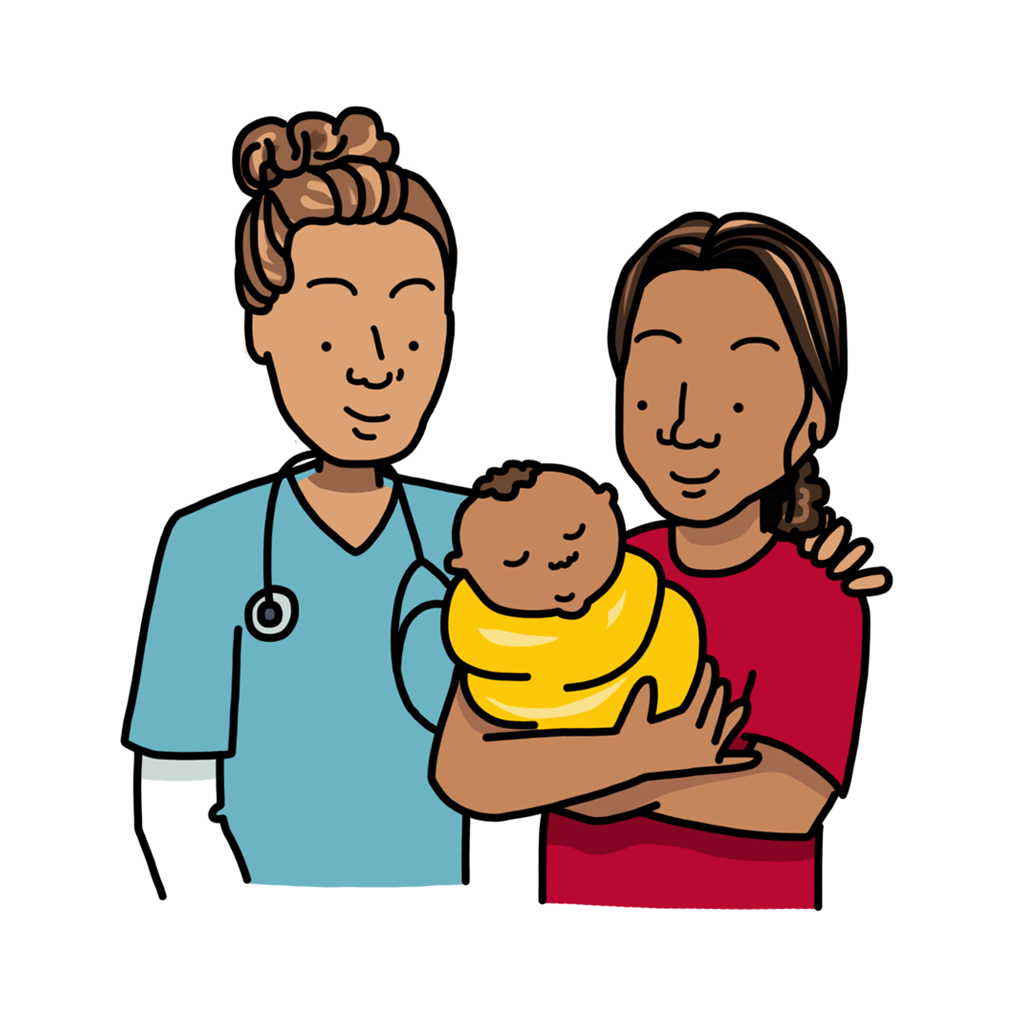
By 2031, increase the proportion of Aboriginal and Torres Strait Islander babies with a healthy birthweight to 91%.
Outcome 2 – Aboriginal and Torres Strait Islander children are born healthy and strong.
-
Indicators
Drivers:
Proportion of mothers who smoke during pregnancy (any time, or after 20 weeks) by age groups
Proportion of mothers who consume alcohol during pregnancy by age groups
Proportion of pregnant mothers with a pre-existing health condition (gestational diabetes, obesity, hypertension, other)
Use of antenatal care by pregnant women:
proportion with five or more antenatal visits
proportion with at least one antenatal care visit in the first trimester
Proportion of pre-term births
Contextual information:
Progress towards parity
Disaggregation
States/territories
Remoteness areas
Socio-economic status of the locality
Gender
Data development
Explore measures and report:
Access to culturally appropriate antenatal care for mothers of Aboriginal and Torres Strait Islander babies based on location
Role of Aboriginal and Torres Strait Islander men in parenting
Other risk factors such as alcohol and drug use during pregnancy in National Perinatal Data Collection which is linked to birthweight and preterm birth
Educational status of parents

Target 3
By 2025, increase the proportion of Aboriginal and Torres Strait Islander children enrolled in Year Before Fulltime Schooling (YBFS) early childhood education to 95%.
Outcome 3 – Aboriginal and Torres Strait Islander children are engaged in high quality, culturally appropriate early childhood education in their early years.
-
Indicators
Contextual information:
Rate of attendance in early childhood education in the year before full-time schooling
Number of Aboriginal and Torres Strait Islander early childhood education and care service providers
Progress towards parity
Disaggregation
States/territories
Remoteness areas
Socio-economic status of the locality
Gender
Data development
Rate of enrolment and attendance of three-year-olds (two years before full-time schooling) in early childhood education
Proportion of early childhood education facilities attended by Aboriginal and Torres Strait Islander children meeting or exceeding National Quality Standard
Access to culturally appropriate early childhood education programs
Access to bilingual education
Number of Aboriginal and Torres Strait Islander early years’ service providers
Barriers to attendance (including out-of-pocket costs, access to services, transport, housing)
Parental education, health and disability
Health and disability of children
Lessons from Commonwealth, state and territory early childhood education support initiatives
When this target is met, develop future targets for enrollment and attendance rates for two years before full-time schooling.

Target 4
By 2031, increase the proportion of Aboriginal and Torres Strait Islander children assessed as developmentally on track in all five domains of the Australian Early Development Census (AEDC) to 55%.
Outcome 4 – Aboriginal and Torres Strait Islander children thrive in their early years.
-
Indicators
Drivers:
Preschool attendance and enrolment
Primary carer education level
Contextual information:
Outcomes by AEDC domains (developmentally vulnerable, at risk, on track)
AEDC Multiple Strengths Indicator (highly developed, well developed and emerging strengths)
Progress towards parity
Disaggregation
States/territories
Remoteness areas
Socio-economic status of the locality
Gender
Data development
Explore options to measure and report:
Culturally-appropriate childhood development, such as the provision of early childhood education by community-controlled organisations
Health of children
Proportion of children who have regular health and development check-ups
Rates of access to nurse home visiting programs
Proportion of Aboriginal and Torres Strait Islander children living in poverty

Target 5
By 2031, increase the proportion of Aboriginal and Torres Strait Islander people (age 20-24) attaining year 12 or equivalent qualification to 96%.
Outcome 5 – Aboriginal and Torres Strait Islander students achieve their full learning potential.
-
Indicators
Drivers:
School attendance
School retention rates
At or above National Assessment Program – Literacy and Numeracy (NAPLAN) minimum standards in reading, writing and numeracy for Years, 3, 5, 7 and 9
Mean scores of Aboriginal and Torres Strait Islander 15-year olds in the Programme for International Student Assessment (PISA) test
Contextual information:
Mean score of NAPLAN reading, writing and numeracy for Years, 3, 5, 7 and 9
Rates of highest education/training level completed (for those not completing Year 12 or equivalent)
Progress towards parity
Disaggregation
States/territories
Remoteness areas
Socio-economic status of the locality
Year 12 vs Certificate III or above completions (Certificate III but without year 12)
Gender
Disability status
Data development
Explore options to measure and report:
Year 12 completions, based on school administrative records
Completion of Certificate II and III or higher by those who do not have Year 12, based on Vocational Education and Training (VET) administrative records
Disability status (severe/profound disability status) and disability type (physical, cognitive, sensory, social/emotional)
Student experiences of racism
Parent highest level of education, and employment status
Barriers to attendance and support required to complete Year 12 (for those who have not completed Year 12)
Proportion studying ATAR eligible Year 12 program, and Australian Tertiary Admission Rate (ATAR) score
English as an Additional Language/Dialect student

Target 6
By 2031, increase the proportion of Aboriginal and Torres Strait Islander people aged 25-34 years who have completed a tertiary qualification (Certificate III and above) to 70%.
Outcome 6 – Aboriginal and Torres Strait Islander students reach their full potential through further education pathways.
-
Indicators
Drivers:
Higher education commencement (university component), attrition, and completion rates (time series, cohort analyses – 4, 6 and 9 years)
Higher education application, offers and acceptance rates (by gender, SES and ATAR levels)
Cert III and above VET commencements, attrition and completion rates
Contextual information:
Field of Education for higher education and VET
Higher education students’ views on outcomes, behaviours and satisfaction
Destinations and satisfaction of higher education graduates
VET graduate outcomes and satisfaction levels
Progress towards parity
Disaggregation
States/territories
Remoteness areas
Socio-economic status of the locality
Proportions completing tertiary qualifications by highest qualification achieved (Australian Qualifications Framework (AQF) level)
Disability status
Gender
Data development
Explore options to measure and report:
Costs and barriers to tertiary enrolment and completions, students in receipt of scholarship/s
Student health status
Proportion of students who are first in their family to undertake higher education
Proportion of school-leavers going into higher-level VET and Higher education, by qualification level

Target 7
By 2031, increase the proportion of Aboriginal and Torres Strait Islander youth (15-24 years) who are in employment, education or training to 67%.
Outcome 7 – Aboriginal and Torres Strait Islander youth are engaged in employment or education.
-
Indicators
Drivers:
Proportion of youth Not Engaged in Employment, Education or Training (NEET) by disability, long term health condition, caring responsibility, looking for work
Proportion of NEET by main reason for not studying in last 12 months
Contextual information:
For youth engaged in education:
Type of educational institution attending (school/ technical and further education/higher education)
Highest education level completed
For youth engaged in employment:
Proportion self-employed
Proportion by occupation
Proportion by industry
Proportion not engaged in employment, education or training (NEET) by:
Highest education level completed
Progress towards parity
Disaggregation
Geographic area (jurisdiction, remoteness, other geographic categories available)
Socio-economic status of the locality
Single year of age (to capture compulsory education age)
Gender
Disability status
Categories of engagement with employment, education or training (eg. full-time study and part-time employment, full-time study, full-time employment, part-time study and employment)
Data development
Explore options to measure and report:
Barriers to youth engagement
Caring responsibility
Financial limitations
Long-term health condition
Mental health or psychological distress
Lack of transport
Homelessness
Domestic violence
Discrimination
Substance misuse
Incarceration and recidivism.

Target 8
By 2031, increase the proportion of Aboriginal and Torres Strait Islander people aged 25-64 who are employed to 62%.
Outcome 8 – Strong economic participation and development of Aboriginal and Torres Strait Islander people and communities.
-
Indicators
Drivers:
Highest level of educational attainment
Long term health and disability status
Caring responsibilities
Contextual information:
Employment by occupation
Employment by industry
Median equivalised gross household income
Median personal income
Labour force participation
Self-managed business owners
Progress towards parity
Disaggregation
States/territories
Remoteness areas
Socio-economic status of the locality
Disability status
Gender
Age group
Level of education
Type of employment – part-time versus full-time
Data development
Explore options to measure and report:
Employment security (permanent of casual)
Aboriginal and Torres Strait Islander owned businesses including:
Number and as a proportion of all businesses
Growth and revenue
Sectors and industries
Barriers to labour market participation including health and disability
Underemployment among Aboriginal and Torres Strait Islander people
Long-term unemployment and welfare dependency
Median personal income from employment

Target 9
A) By 2031, increase the proportion of Aboriginal and Torres Strait Islander people living in appropriately sized (not overcrowded) housing to 88%.
B) By 2031, all Aboriginal and Torres Strait Islander households:
Within discrete Aboriginal and Torres Strait Islander communities receive essential services that meet or exceed the relevant jurisdictional standard
In or near a town receive essential services that meet or exceed the same standard as applies generally within the town (including if the household might be classified for other purposes as a part of a discrete settlement such as a “town camp” or “town based reserve”.)
Outcome 9 – Aboriginal and Torres Strait Islander people secure appropriate, affordable housing that is aligned with their priorities and need.
-
Indicators
Change in population by location
Change in social housing dwellings by location
Contextual information:
Home ownership rate (including by location and tenure type)
Homelessness rate including by type (eg. Transitional housing/sleeping rough) and age group
Structural problems including functional health hardware Australian Bureau of Statistics (ABS) measure of acceptable standard of housing)
Low income household experiencing rental stress/mortgage stress
Social housing dwellings per 100 households by location
Progress towards parity
Rate of Rheumatic Heart Disease (RHD) diagnoses, by severity at diagnosis
Hospitalisation rates for environmentally based diseases
Mortality rates for diseases associated with poor environmental health
Disaggregation
States/territories
Remoteness areas
Other small geographic areas (where possible)
Socio-economic status of the locality
Disability status
Gender
Age group
Overcrowding status (1, 2, 3, 4 or more additional bedrooms required)
Tenure type
Data development
Explore options to measure and report:
Levels of overcrowding specific to Australian conditions
Proximity to services (in addition to the ABS’ current remoteness structure reporting)
Affordable living (including cost of electricity, transport costs, etc.)
Environmental health outcomes (eg rheumatic fever and rheumatic heart disease)
Environmental health activities (eg programs, services and partnerships)
Family and kin obligations that lead to overcrowding (temporary or permanent)
Social housing, including:
Transfers from social housing to private rental and/or home ownership
Satisfaction of social housing tenants with amenities, location, and maintenance services
Social housing dwellings as a proportion of all dwellings
Aboriginal and Torres Strait Islander households’ access, relative to relevant standards, to safe drinking water
Aboriginal and Torres Strait Islander households’ access, relative to relevant standards, to waste management services
Aboriginal and Torres Strait Islander households’ access, relative to relevant standards, to sewerage systems
Aboriginal and Torres Strait Islander households’ access, relative to relevant standards, to electricity supply
Proportion of Aboriginal or Torres Strait Islander communities with populations of less than 50 receive essential services that meet or exceed the relevant jurisdictional standard

Target 10
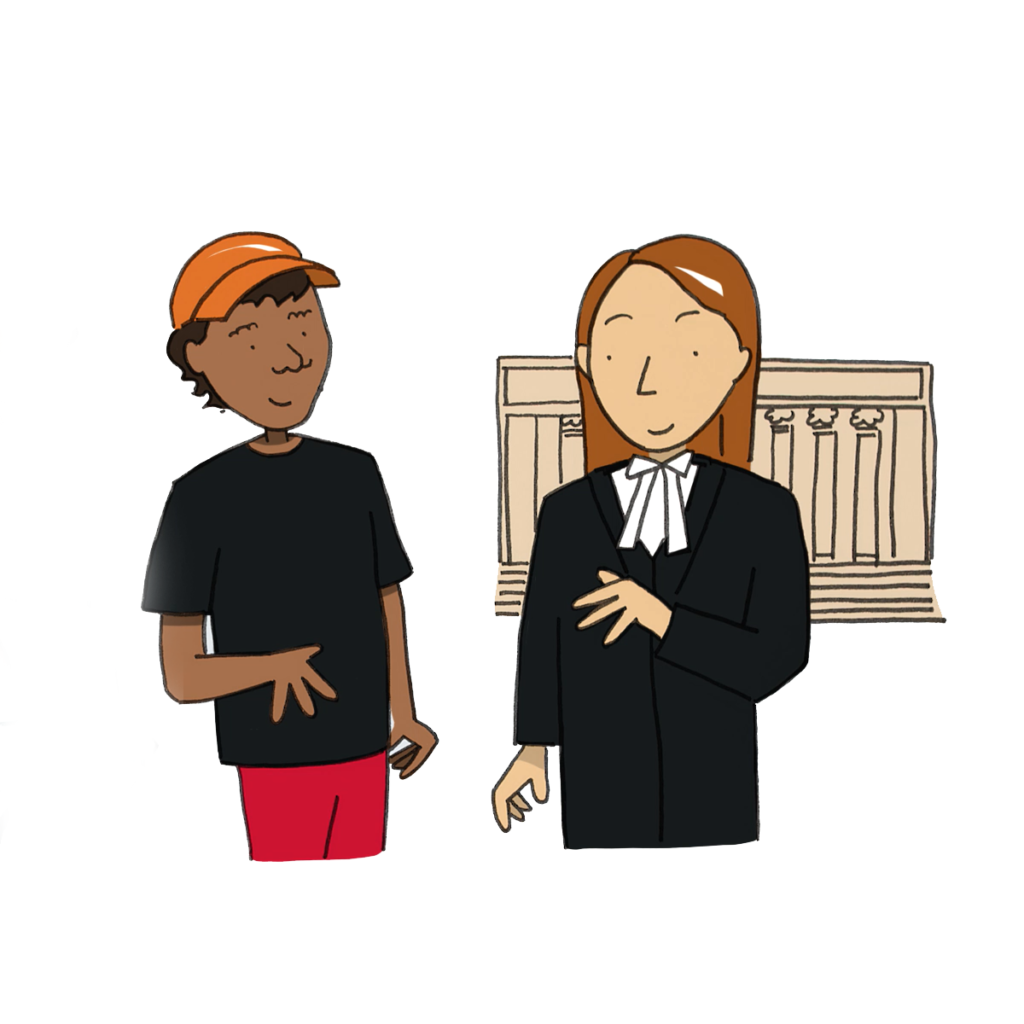
By 2031, reduce the rate of Aboriginal and Torres Strait Islander adults held in incarceration by at least 15%.
Outcome 10 – Aboriginal and Torres Strait Islander people are not overrepresented in the criminal justice system.
-
Indicators
Drivers
Proportion of Aboriginal and Torres Strait Islander people charged by police
Proportion of Aboriginal and Torres Strait Islander people convicted and sentenced (by offence and type of sentence)
Aboriginal and Torres Strait Islander prisoner by offence type (most serious and other offences) and number of offences
Proportion of prisoners by legal status (sentenced vs unsentenced); and by sentence length
Number and rate of unique alleged offenders processed by police
Proportion of prisoners previously incarcerated; number of unique episodes of incarceration
Mental health, substance abuse issues, family history of incarceration, employment post release, history of victimisation
Entry rate to incarceration – newly sentenced to prison
Contextual information:
Rates of death in prison custody of Aboriginal and Torres Strait Islander prisoners, by cause of death
Proportion spending greater periods of time on remand
Progress towards parity
Disaggregation
Geographic area (jurisdiction, remoteness, other geographic categories available)
Socio-economic status of the locality
Age
Gender
Data development
Explore options to measure and report:
Access to services in police custody
Aboriginal community-controlled legal services, including data on police use of custody notification systems
Cultural competency training completed by police
Access to services in prison (disaggregated by sentenced/unsentenced prisoners)
Availability of and participation in culturally safe health and mental health services, including health and disability assessment on entering prison
Support provided to prisoners who are parents to keep engaged with family
Cultural competency training completed by corrections staff
Availability of and participation rates for prison-based programs, including vocational training, behavioural and specialist programs such as addiction
Access to services in police custody
Rehabilitation and reintegration support, and building cultural strength
Police data on caution, diversion, arrests and stops by Indigeneity, including multiple instances of contact, and deaths in police custody
Proportion of offenders denied bail/parole by type of offence and reason for denial (including lack of accommodation)
Data linkages to identify long term outcomes after incarceration (employment, education)
Data disaggregation by age at first contact with the criminal justice system
Target 11
By 2031, reduce the rate of Aboriginal and Torres Strait Islander young people (10-17 years) in detention by 30%.
Outcome 11 – Aboriginal and Torres Strait Islander young people are not overrepresented in the criminal justice system.
-
Indicators
Drivers
Un-sentenced detention rates
Average time in detention for unsentenced youth
Proportion of young alleged offenders (10-17 years) involved in police proceedings including charges and summons, cautions, diversions
Proportion of young people convicted and sentenced, by type of sentence (community supervision, detention)
Entrant rate to detention – newly sentenced to youth detention
Proportion of youth under community supervision transitioning to detention
Young people returning to detention or community supervision
Proportion of young people first coming into youth justice system aged 10-13 (offending and courts data, first entry to detention)
Contextual information:
Community supervision trends
proportion of young people in detention who had received child protection services (including out-of-home care)
Proportion exiting detention, by reason
Progress towards parity
Disaggregation
Geographic area (jurisdiction, remoteness, other geographic categories available)
Socio-economic status of the locality
Age (10-13, 14-17 year olds)
Gender
Data development
Explore options to measure and report:
Disaggregation of police contact by caution, charges, prosecution, and diversion (by type)
Detentions by offence type
Reasons for young people being placed on remand
Access to services at first interaction with criminal justice system, by type and availability
Training provided and undertaken by police and workers engaging with youth, including cultural safety and trauma-informed practice
Access to services in detention (health, trauma, mental health and wellbeing, cultural engagement and support of young people in detention
Disaggregation of data by:
Disability status, including prevalence of neurodevelopmental impairment and foetal alcohol spectrum disorder
Geographic area of residence/offending
Consistent definitions of youth detention and recidivism across jurisdictions
Rates of death in prison custody of Aboriginal and Torres Strait Islander youth prisoners, by cause of death
Proportion of young people in detention who had:
Experienced domestic and family violence, abuse/neglect
Received alcohol and other drug treatment services (ongoing reporting)
Received specialist homelessness services
Experienced mental health issues
Been expelled or suspended from school
Access to culturally secure services and programs while in detention, by type and timing of service

Target 12
By 2031, reduce the rate of over-representation of Aboriginal and Torres Strait Islander children in out-of-home care by 45%.
Outcome 12 – Aboriginal and Torres Strait Islander children are not overrepresented in the child protection system.
-
Indicators
Drivers:
Number of Aboriginal and Torres Strait Islander children in out-of-home care
Proportion of children in out-of-home care (0-17 years old) that are Aboriginal and Torres Strait Islander
Proportion of children on care and protection order that are Aboriginal and Torres Strait Islander
Contextual information:
Proportion of children (0-17 years old) who spent time in out-of-home care by length of time categories (i.e. 12 months, 24 months etc.) that are Aboriginal and Torres Strait Islander
Measuring progress of the application of the Aboriginal and Torres Strait Islander Child Placement Principle (ATSICPP): Proportion of Aboriginal and Torres Strait Islander children in out-of-home care by type of placement; by relationship with caregiver
Proportion of children aged 0-17 in out-of-home care that are Aboriginal and Torres Strait Islander who were placed with relatives or kin, or other Aboriginal and Torres Strait Islander carers
The proportion of children aged 0-17 in out-of-home care that are Aboriginal and Torres Strait Islander who have current documented and approved cultural support plans
Proportion of children admitted to out-of-home care that are Aboriginal and Torres Strait Islander
Proportion of children who exited out-of-home-care to a permanency outcome that are Aboriginal and Torres Strait Islander
Proportion of children 0-17 discharged from out-of-home care that are Aboriginal and Torres Strait Islander
Proportion of children that are Aboriginal and Torres Strait Islander aged 0-16 who exited out-of-home care to reunification in the previous year and did not return to out-of-home care in 12 months or less
Proportion of children who were subjects of substantiations of notifications that are Aboriginal and Torres Strait Islander
Rates of substantiation of a notification by type of abuse, including emotional abuse, neglect, physical abuse and sexual abuse
Proportion of children who were the subject of a substantiation of a notification that are Aboriginal and Torres Strait Islander by type of abuse, including emotional abuse, neglect, physical abuse and sexual abuse
Disaggregation
Age
Gender
Indigenous status where available
Data development
Explore options to measure and report:
Measures of culturally competent child protection response:
National Compliance Framework for the ATSICPP that is consistent with indicators being developed by the Australian Institute of Health and Welfare (AIHW), in collaboration with the Secretariat of National Aboriginal and Islander Child Care (SNAICC), Child and Family Services (CAFS) Strategic Information Group (SIG) and Children and Families Data Network (CAFDAN), across jurisdictions, to fully measure the five elements of the ATSICPP: prevention, placement, partnership, participation and connection.
Rates of children and families accessing family support services and intensive family support services
Proportion of children and families accessing family support services and intensive family support services that are Aboriginal and Torres Strait Islander
Self-reported safety and wellbeing in out-of-home care, including perceived: safety in placement, mental health and wellbeing and connection to family, community and culture
Rates of re-substantiation of a notification by type of abuse, including emotional abuse, neglect, physical abuse and sexual abuse
Proportion of children 0-17 discharged from out-of-home-care due to ageing out that are Aboriginal and Torres Strait Islander
The prevalence of child maltreatment of Aboriginal and Torres Strait Islander children linked to the Australian Child Maltreatment Study
Disaggregation
Geographic area (jurisdiction, remoteness, other geographic categories available)
SES of the locality

Target 13
By 2031, the rate of all forms of family violence and abuse against Aboriginal and Torres Strait Islander women and children is reduced at least by 50%, as progress towards zero.
Outcome 13 – Aboriginal and Torres Strait Islander families and households are safe.
-
Indicators
Contextual information
For Aboriginal and Torres Strait Islander women and children:
Rates of Aboriginal and Torres Strait Islander child protection substantiations related to family violence
Rates of Aboriginal and Torres Strait Islander children entering out-of-home care and receiving protection orders, where family violence is indicated
Rates of victims of family and domestic violence recorded by police (NSW, QLD, SA & NT)
Rates of victims of sexual assault by victim-offender relationship
Rates of self-reported physical violence by relationship to perpetrator (15 years old +)
Hospitalisation rates for family and domestic violence related to assaults for women and children; by relationship to perpetrator
Homicide victim rates, by victim-offender relationship
Proportion seeking assistance from Specialist Homelessness Services for reasons of domestic/family violence
Proportion of Aboriginal and Torres Strait Islander women who consider that violence is a problem in their community
Disaggregation
Geographic area (jurisdiction, remoteness, other geographic categories available)
Socio-economic status of the locality
Age
Data development
Explore options to measure and report:
Rates of access to support services, including mainstream family violence services and Aboriginal and Torres Strait Islander specific services, such as Family Violence Prevention Legal Services and Family Advocacy and Support Services (FASS)
Rates of Aboriginal and Torres Strait Islander families’ engagement with the family law system
Rates of access to family support and intensive family support services
Consistency in identification, capturing and counting procedures between different data sets and jurisdictions
Improved capture of cause of injury in national emergency department data
Long-term pathways, impacts and outcomes for victims, perpetrators and their children
Rates of self-reported family and domestic violence and abuse including coercive control, physical abuse, sexual abuse, emotional abuse, financial abuse and technological abuse
Rates of family and domestic violence and abuse among Indigenous women and children – including coercive control, physical abuse, sexual abuse, emotional abuse, financial abuse and technological abuse
Perpetrators of violence against Aboriginal and Torres Strait Islander women and children by Indigenous status
The prevalence of child maltreatment of Aboriginal and Torres Strait Islander children linked to the Australian Child Maltreatment Study
Community attitudes towards violence against women and children

Target 14
Significant and sustained reduction in suicide of Aboriginal and Torres Strait Islander people towards zero.
Outcome 14 – Aboriginal and Torres Strait Islander people enjoy high levels of social and emotional wellbeing.
-
Indicators
Drivers:
Non-fatal hospitalisations for intentional self-harm
Intentional self-harm mortality rate (suicide)
Hospitalisations for mental health-related disorders
Contextual information:
Proportion of Aboriginal and Torres Strait Islander people reporting experiencing psychological distress
Proportion of people reported experiencing one of more barriers accessing health services
Mental health-related disorders mortality rates
Proportion who report having experienced racism in the previous 12 months
Disaggregation
States/territories
Remoteness areas
Socio-economic status of the locality
Gender
Age group
Data development
Explore options to measure and report:
Mental health related Medicare services by GPs, Psychologists and Psychiatrists
Specialised mental health care services
Barriers to accessing mental health services
Improve the quality of Aboriginal and Torres Strait Islander identification in deaths data, to support reporting of mental health-related mortality data including self-harm mortality data for all states and territories, and at regional/community levels
Main factors leading to suicide by Aboriginal and Torres Strait Islander people
Alternative measure of psychological distress (preferably non-survey based)
Mental and behavioural mortality data including self-harm mortality data for all states and territories, and at regional/community levels
Prevalence of racist attitudes against Aboriginal and Torres Strait Islander people held by the Australian community
Rate of Aboriginal and Torres Strait Islander people who feel a strong connection to culture and community
Explore measures of suicide ideation, particularly among youth

Target 15
A) By 2030, a 15% increase in Australia’s landmass subject to Aboriginal and Torres Strait Islander people’s legal rights or interests.
B) By 2030, a 15% increase in areas covered by Aboriginal and Torres Strait Islander people’s legal rights and interests in the sea.
Outcome 15 – Aboriginal and Torres Strait Islander people maintain a distinctive cultural, spiritual, physical and economic relationship with their land and waters
-
Indicators
Drivers
Aboriginal and Torres Strait Islander people’s owned land and water titles
Number of land claims resolved under Commonwealth, state and territory land rights legislation
Number of positive Native Title Determinations
Contextual information:
Number of Indigenous Land Use Agreements (ILUAs) on the Register of Indigenous Land Use Agreements
Income of registered native title bodies corporate as reported to the Office of the Registrar of Indigenous Corporations (ORIC), including income from businesses or grants
Charitable trusts holding native title and land rights monies
Number of Aboriginal and Torres Strait Islander people employed in water and land management
Australia’s conservation estate that is managed by Aboriginal and Torres Strait Islander people
Proportion of Aboriginal and Torres Strait Islander people who recognise and live on homelands/traditional country
Disaggregation
States/territories
Data development
Explore options to measure and report:
• Indicators for land use and development
Target 16
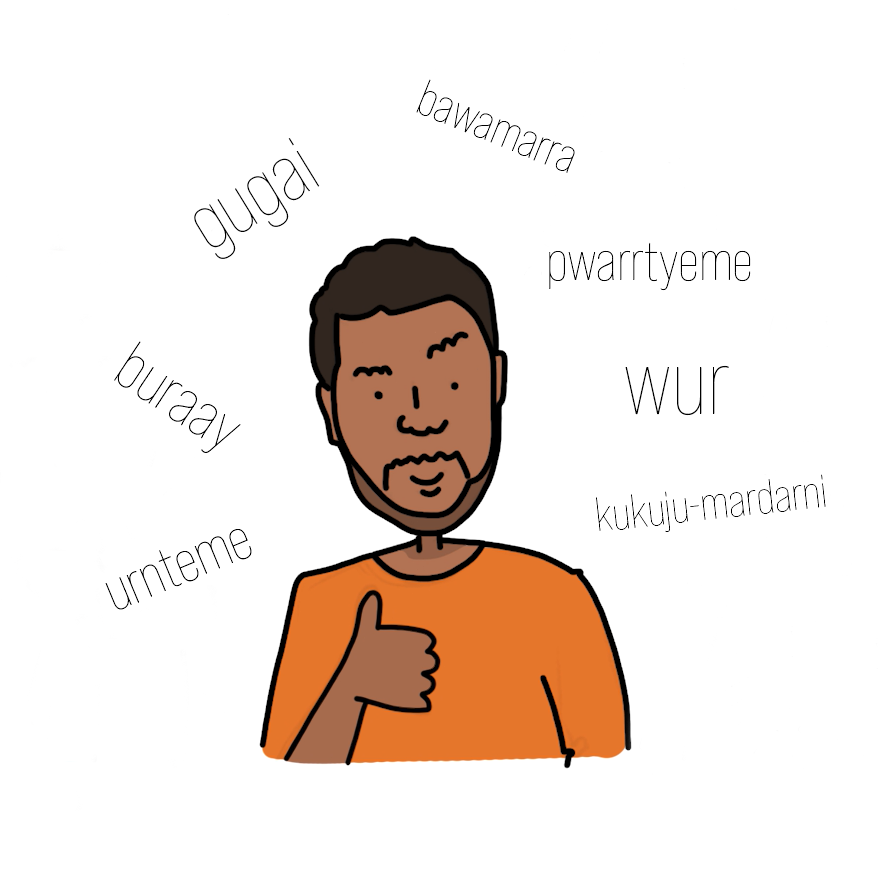
By 2031, there is a sustained increase in number and strength of Aboriginal and Torres Strait Islander languages being spoken.
Outcome 16 – Aboriginal and Torres Strait Islander cultures and languages are strong, supported and flourishing.
-
Indicators
Proportion of Aboriginal and Torres Strait Islander languages categorised as strong
Number of Aboriginal and Torres Strait Islander languages being spoken
Number and age profile of the speakers of Aboriginal and Torres Strait Islander languages, including children
Proportion of Aboriginal and Torres Strait Islander people who speak an Indigenous language
Contextual information:
Number of Aboriginal and Torres Strait Islander people accessing Commonwealth funded language centres to maintain and preserve languages
Disaggregation
Languages by:
Traditional language and Kriol / Creole language
Geographic area (jurisdiction, remoteness where possible)
Strength of languages (according to AIATSIS measures) including languages in the process of retrieval/revival
Age
Gender
Data development
Measures of Aboriginal and Torres Strait Islander languages being taught/transmitted/spoken in Aboriginal community settings and organisations, including Language Centres
Measures of Aboriginal and Torres Strait Islander languages spoken in Aboriginal community settings, particularly in family life
Measures of Aboriginal and Torres Strait Islander languages being taught in early-learning, primary and secondary schools
Other demographic measures of people who speak an Aboriginal and Torres Strait Islander language
Other economic opportunities that arise for people who speak an Aboriginal and Torres Strait Islander language
Measures of Aboriginal and Torres Strait Islander languages used in media
Alternative indicators that demonstrate growth and strength of Aboriginal and Torres Strait Islander cultures
Definition and measures of cultural enterprises that are associated with language growth and development Number of people employed as translators for Aboriginal and Torres Strait Islander languages

Target 17:
By 2026, Aboriginal and Torres Strait Islander people have equal levels of digital inclusion.
Outcome 17 – Aboriginal and Torres Strait Islander people have access to information and services enabling participation informed decision-making regarding their own lives.
-
Indicators
Drivers
Levels of digital inclusion among Aboriginal and Torres Strait Islander people as compared with other Australians (disaggregated by access, affordability and digital ability)
Proportion of Aboriginal and Torres Strait Islander households accessing the internet
Proportion of Aboriginal and Torres Strait Islander people accessing the internet (disaggregated by point of access: home, work, school, public access, government shopfront)
Frequency of internet access at home in last 12 months (daily, weekly, monthly, yearly)
Proportion of Aboriginal and Torres Strait Islander people using internet to access government services for private purposes (e.g. health services, taxation, bill payments, social security payments)
Number of Aboriginal and Torres Strait Islander people employed in media (disaggregated by income levels)
Contextual information:
Number and location of community broadcast licenses with an Indigenous interest
Number and location of broadcast transmitters
Disaggregation
Geographic (jurisdictions, remoteness and other geographic locations available)
SES of locality
Gender
Age group
Disability status
Disaggregation data development
Type of media (community-controlled/mainstream media)
Data development
Ongoing development of regional and remote reporting of the Australian Digital Inclusion Index
Measures relating Aboriginal and Torres Strait Islander participation in the media, in particular community controlled media, including (but not limited to):
Number of First Nations media and Community Controlled media organisations
Audience growth for First Nations media and Community Controlled media organisations
Sources of news content among Aboriginal and Torres Strait Islander populations
Portrayal of Aboriginal and Torres Strait Islander people in mainstream media
Diversity of media content broadcast (including health, education, community service information)
Number of Aboriginal and Torres Strait Islander people work in mainstream media across all levels of media operations (e.g. managers, media practitioners and technical).
Percentage of Aboriginal and Torres Strait Islander people with access to home phone, mobile and/or internet
Proportion of regional and remote communities with access to infrastructure to enable broadcast and telecommunication services.
Number of Aboriginal and Torres Strait Islander people receiving digital literacy training by Aboriginal and Torres Strait Islander community-controlled organisations
Measures relating to proportion of Government communications material produced and distributed by First Nations media organisations (Media buying agencies)
Progress towards parity
